* There is a range of predefined graphical objects that can be used in the project. Examples: ''Project table'', where designer data can be entered and which can be used when printing the project, or interactive elements, such as ''Manifold table'' and ''Component labels''. Upon assigning them to defined system components, they will automatically display current data of these components.
* It is particularly straightforward and problem-free to make all kinds of modifications to the project - the ergonomics and ease of calculation of the modified design is one of the biggest advantages of the working environment of '''InstalSystem 5'''.<br/>[[File:Graphical-edit.png|900 px|left|thumb|22. Installation edit]]<br clear="all"/>
'''Detailed information on ''Installation edit'', in the context of the type of system being designed or calculations performed is given in the descriptions of program applications''' - see:[http://en.help.instalsoft.com/InstalSystem_5#Software_applications SOFTWARE APPLICATIONS].
Verification of the correctness of installation structure
Before detailed component data are appended it is a good idea to check the structure of the system and component connections. Corrections made to the structure may cause changes or even removal of some of the components, then the time spent on entering data would be lost. The following tools are available:
The tool that enables checking connections between system components in the project is the Check connections function, which is also available through the keyboard shortcut Shift+F2. 23. "Check connections" function
The tool that enables visual verification of the installation structure is, as is the case with building structure verification, the 3D view. The 3D view can be enabled permanently, which allows verifying system correctness continuously during editing. In this case it is particularly advantageous to work using two display monitors simultaneously. Note, however, that using 3D view slows down the program. When working on a slow computer or working with a large project, it is better to enable 3D view only to verify the status of the project, and to do the design work without opening the 3D view window. 文件:Installation-project.png24. Installation structure
Component data edit
Every component in the project has its set of data. Editing these data is possible in the Data table after marking that component. This applies to components of the building structure, components of all systems under design, and other components that are objects of the program, such as the "Graphical file" mentioned when discussing the import of storey plan views or the "Print layout". The Data table can be toggled on/off by selecting it in the Window menu on the toolbar.
A significant portion of the data of new components placed in the drawing is appended automatically. This highly facilitates work on the project. The range of automatically appended data differs depending on the type of component and on other factors.
The basic mechanism in this area is propagation of General data
Some data are established based on component location and size / shape of component placed in the drawing
Many detailed data of components that are associated with catalogue data and have a specified catalogue type are read from the catalogue.
Any default data can be overwritten with other data at any time. Information on whether the current value is derived from the "General data" or is another type of default data, or whether it is a user-defined value, is in the form of an icon placed to the right of the data field in the Data table. Clicking this symbol changes the data status. In particular it enables reverting to the Default status.
A Computer symbol indicates a default value
A Pencil symbol indicates a user-specified value
Data of any component can be entered or modified at any moment when working with the project.
Component data can be edited right after placing the component in the project, and this is recommended for some components. This particularly applies to these components that do not depend on other drawing components and the number of which in the project is low.
In the case of components the number of which is high it is advisable to edit their data at one stage to take advantage of group editing. To this end it is necessary to press and hold the Ctrl key and click every component to be marked. After marking multiple components, the data fields common to all those marked components will be accessible in the Data table, and every change made to selected data will modify that data for all marked components. Therefore it is very useful to conduct group editing of data of components of the same type, e.g. of many rooms.
Calculations and diagnostics
Calculations include all operations necessary to obtain complete results: data propagation, component sizing, engineering calculations and automatic graphical editing. All data that have an effect on the selected scope of the project are taken into consideration: general data, building data, drawings of the system under design, parameters of components used to construct the system taken from catalogues. This means that the program automatically provides high level of completeness and consistency of data and results. This approach greatly facilitates reverting to any of the previous stages of editing - after changing selected data, calculations can be conducted again to obtain complete and current results. Ease of reverting provides great comfort and speed of work in the context of calculating various design options, taking into account the changing requirements of the project developer or changes in the structure of the building introduced during the design of the installation.
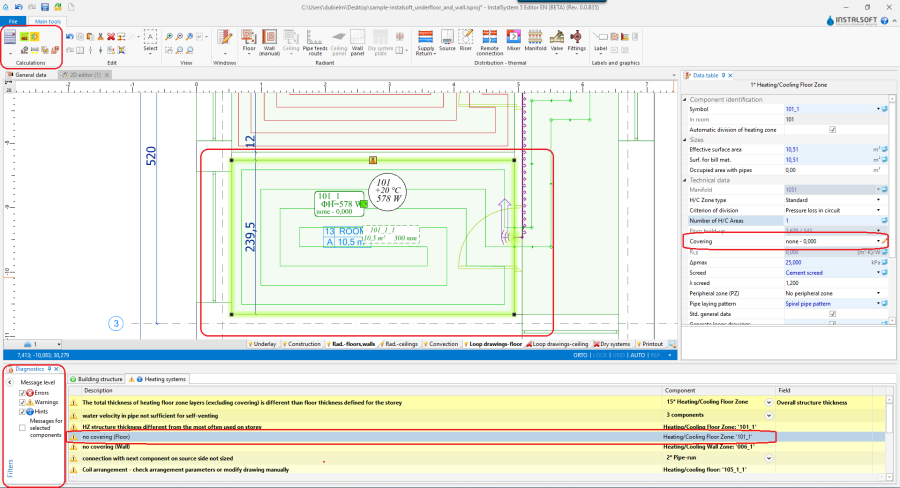
Starting calculations - the Calculation section of the Main tools bar contains tools that enable starting and managing calculations. Calculations can be made for the entire project or for selected scopes.
Diagnostics and error list - at the start data completeness and correctness is verified. Significant errors in the data result in error messages and halted calculations. If there are no significant errors, calculations are completed and the error list is filled with diagnostic messages. These messages provide information on errors that do not halt calculations and warnings and hints regarding the course of calculations and obtained results. The Errors window is accessible through the Display and program windows menu. Initially all messages are displayed in bold font. Double clicking on a message enables finding the components or data referred to in the message in all open windows, for instance: Graphical edit, Data table, Calculation results. After the first search the message is displayed in normal font, meaning that it has been "checked". The pop-up menu available after selecting the message and right clicking allows viewing all components which encountered a similar problem. The range of displayed groups of messages can be controlled using the Filters function.
Errors - messages of highest importance, displayed in uppercase. Critical errors halt calculations and must be eliminated. There are also errors that do not halt calculations, but nevertheless they must be closely analysed and rectified.
Warnings - messages of lesser importance than errors, displayed in lowercase letters and they do not block further calculations. Warnings are usually associated with data or results that are presumably incorrect, therefore it is always advisable to read the displayed warnings.
Hints - messages intended to remind of or draw attention to some data or results.
Messages for selected components. 26. Error list
Calculation results - in the InstalSystem the entire project may have a "calculated" status or a "not calculated" status. First calculation run changes the project status into "calculated". Calculations have an effect on the information displayed in many windows of the application. Importantly, changes made in data after first calculations do not cause deletion of results, results of the last calculations are available. An appropriate message warns of such status of the project. Results in the Label are crossed out if the project has changed. The most important result components:
Tables and lists available in the Calculation results window. 文件:Calculation-results.png27. Calculation results
Components displayed in the project drawing in the Graphical edit window, for instance results displayed in component labels or graphical components drawn or modified during automatic edit operations.
Information available after completing calculations, but not displayed permanently, for instance detailed results available in Graphical edit in Hints appearing in the case of most components when cursor is placed over it. 文件:Pipe-run-results-hint.png28. Pipe-run hint
Detailed information on calculations and results in the context of the various types of systems is given in the descriptions of software applications - see:SOFTWARE APPLICATIONS
Preparation of drawings for export/printing
After making all the required changes to the project and completing calculations, project components that complement information provided in printouts can be entered into the project. These components have an informative nature, and they do not affect calculations. It is advisable to place them in the project at this stage only, as the iterative work with the project at the earlier stages may require modification also in this respect. Including them at the final stage of work may prove most efficient. Detailed information on the available types of components in the context of the various types of installations is given in the descriptions of software applications - see:SOFTWARE APPLICATIONS.
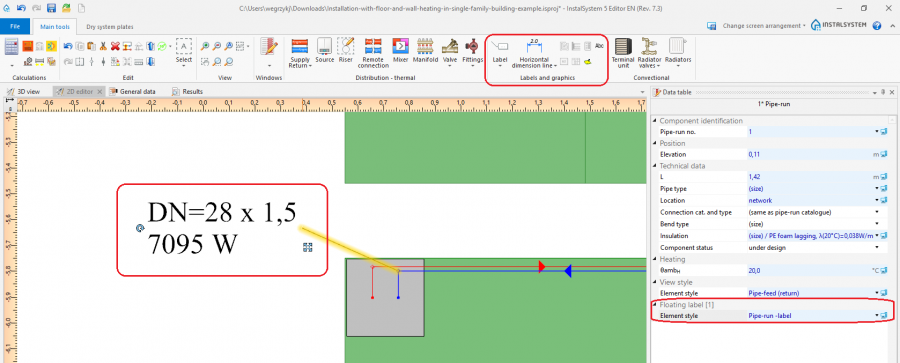
Example Component labels accessible through Main tool bar in the Labels and graphics section. A label is placed by selecting the appropriate icon in the toolbar and clicking the component to which the label is to be assigned. Upon marking in the drawing a component with a label, the label style can be selected in the Data table. 29. Component label The user can configure the label style - see section 5 Component appearance configuration and editing parameters configuration in General data. The user can create and save his/her own label styles of various configuration.
Export/print results and drawings
Result tables and drawings can readily be printed or exported in one of the many available formats.
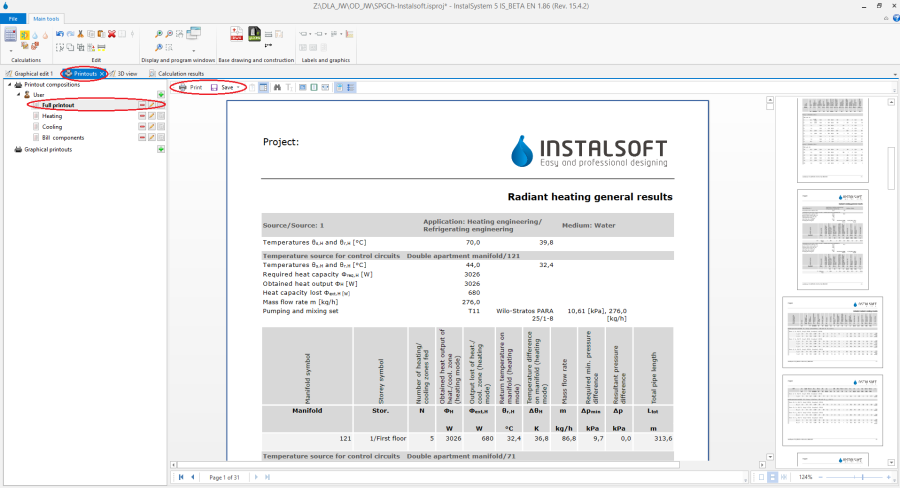
Print tables and lists - to print or export it is necessary to open the Printouts window. The tree displayed on the left side shows the available predefined printout compositions. The number and types of predefined proposals depend on the software version used. A composition can be selected and its content viewed. Then it is only necessary to select Print to obtain a printout or Save and, after selecting the target file format, export the results to this format. It is also possible to create and save user-defined printout compositions. These compositions, in addition to the predefined compositions, are then also available in other projects. 30. Print tables and lists
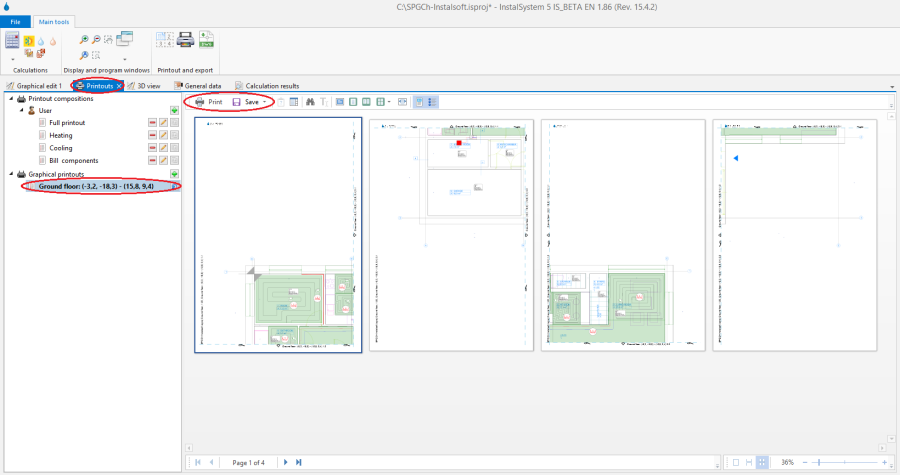
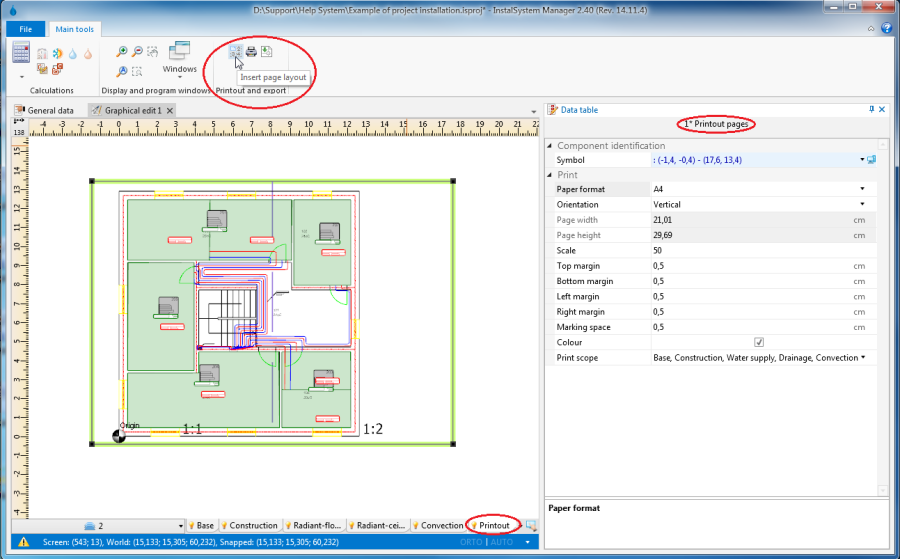
Print drawings - drawings are also printed and exported using the Printouts window. The tree displayed on the left side, below the table printout compositions, shows the graphical printouts defined for the project. The user can define many different layouts of graphical printout. For the defined layout, printing can be effected a number of times, e.g. after every project modification. The range of pages, its setup, style and other parameters are saved. This enables defining various printouts, e.g. one for exporting to a PDF file, another for sending to a printer, yet another for sending to a plotter. 31. Print drawings To set up a graphical printout layout it is necessary to:
Select Printouts tab in the Graphical editor window
At Insetr page layout tool is available in the Printout and export section of the toolbar. This tool enables placing a Printout pages component in the drawing. To each Printout pages component placed in the drawing corresponds a separate graphical printout item in the Printouts window
The Printout pages component can be configured in the data table - a name should be assigned to it, its size, page layout and other style components can be modified
In the graphical edit area the outline of this component can be dragged by the mouse to an appropriate location in the project drawing. Its size can also be changed by dragging one of the corners, whereas the size is always a multiple of full pages. This way the area of the project to be printed can be marked. 32. Printout configuration



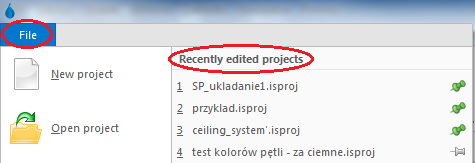
 ,它就会移到清单的顶部并将永久在那个位置
  。
。








 , 就可执行导入的功能了。 在指定了要导入的文件之后,软件就会自动进行处理。当导入gbXML文件时,各楼层的建筑结构以及每一楼层平面图的建筑部件就全部导入了。
 这一命令,给每层图纸标出上下对齐的参考点。 然后打开建筑 标签,按下面手动编辑建筑结构 的描述,给建筑结构放上所需要的部件。在此,导入的底图构成了绘制建筑图的背景,它可加快完成建筑图的编辑。


 - messages of highest importance, displayed in uppercase. Critical errors halt calculations and must be eliminated. There are also errors that do not halt calculations, but nevertheless they must be closely analysed and rectified.
 - messages of lesser importance than errors, displayed in lowercase letters and they do not block further calculations. Warnings are usually associated with data or results that are presumably incorrect, therefore it is always advisable to read the displayed warnings.
 - messages intended to remind of or draw attention to some data or results.